







AI-Assisted Hardware Design
After the camera and calendar integration, my Grafana setup had become a useful little operations display next to the desk. It showed network health, container state, host load, the camera feed, and the day calendar. What it did not show yet was one of the simplest things: the actual weather right outside the apartment.
So I built a small outdoor weather sensor and installed it above the balcony door. This could have been a loose ESP32 board with a few jumper wires, but I wanted to do it properly enough that it could stay outside, survive daily use, and become part of the same monitoring system as everything else.
The finished node now has three layers:
- Hardware: a custom ESP32 weather node with 6 sensors on a two-layer PCB.
- Firmware: ESPHome, static web pages, JSON endpoints, Prometheus metrics, and 12 hours of on-device history.
- Monitoring: a dedicated Grafana weather dashboard backed by its own exporter container.
The more interesting part, however, is how much of the project was shaped with AI assistance. I did not use AI as a magic button. EasyEDA did the actual auto-routing, JLCPCB manufactured the board, and I still had to solder, mount, flash, debug, and install everything myself. But Codex and other AI assistance were present through almost every design step: pin planning, sensor choice, wiring checks, pull-up logic, capacitor placement, documentation, firmware contracts, and the final Grafana integration.
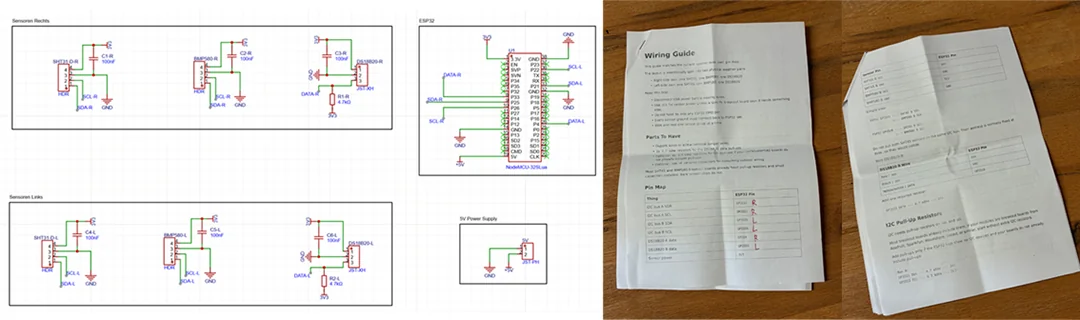
From Idea to PCB
The hardware design is intentionally simple. At the center is a normal ESP32 DevKit-style board. Around it sit two identical weather sensor groups, one for the left side of the box and one for the right side:
2xDS18B20 waterproof temperature probes2xSHT31-D humidity sensors2xBMP580 pressure sensors
That gives me left and right readings for temperature, humidity, and pressure, plus averaged values for the dashboard. The redundancy is not meant to be scientific instrumentation. It is mostly practical: if one side of the enclosure behaves oddly, or one sensor fails, I can see the difference instead of only seeing a single suspicious number.
The first AI-assisted part was not generating a PCB. It was forcing the boring decisions into a clear wiring plan.
For example, both SHT31-D modules default to the same I2C address, and the BMP580 modules also have fixed address behavior depending on the breakout configuration. Instead of trying to solve that with address jumpers everywhere, the final design uses two I2C buses:
- Bus A:
GPIO21/GPIO22 - Bus B:
GPIO25/GPIO26
Each bus gets one SHT31-D and one BMP580. The two DS18B20 probes sit on separate 1-Wire data pins, GPIO4 and GPIO33, each with its own 4.7 kOhm pull-up to 3.3 V.
Codex w/ GPT5.5 was useful here as a persistent advisor and reviewer: It helped keep the pin map consistent across the schematic, wrote the wiring guide, and coded the ESPHome configuration. It also kept pointing back to the small hardware details that are easy to skip when coming from software:
- shared ground across all sensors
- no
5 Vmistakes on ESP32 GPIO pins - correct I2C pull-up assumptions
100 nFdecoupling capacitors placed in parallel across sensor power, not accidentally in series
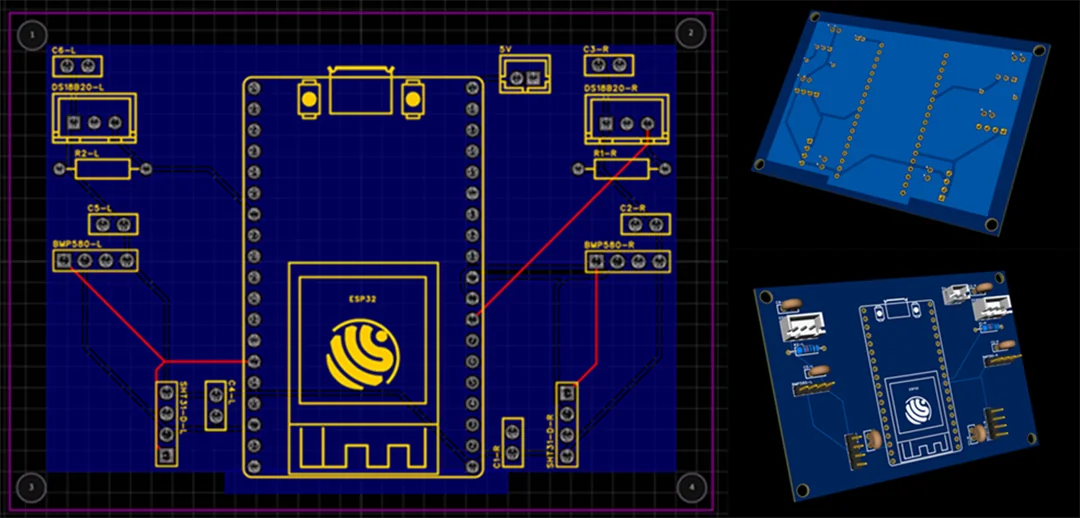
The PCB itself is not complex. It is a two-layer board with a ground plane, a few pull-up resistors, some capacitors for power and signal smoothing, connectors for the sensors, and the ESP32 footprint in the middle. I used EasyEDA Pro for the board and let its auto-router handle the traces.
That is probably the correct level of ambition for this kind of project. I did not need a hand-routed RF masterpiece. I needed a reliable carrier board that replaced a mess of jumper wires with something repeatable, screwable, and easier to mount inside an enclosure.
I ordered the finished PCBs through JLCPCB. The boards cost roughly 20 EUR including shipping and arrived after about a week. I already have soldering equipment here, so I soldered the connectors, resistors, capacitors, and ESP32 headers myself.
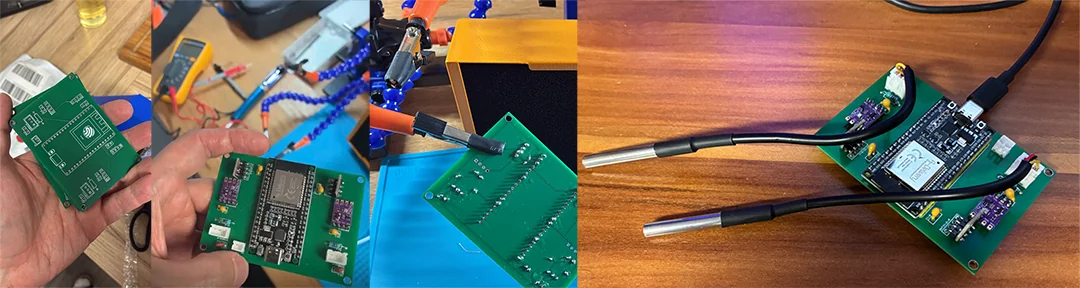
There is something very satisfying about moving from a schematic and routing view to a physical board in the hand. It also changes the error model. In software, a wrong assumption is usually another commit. In hardware, a wrong footprint, wrong pin, or missing pull-up can mean bodge wires, desoldering, or ordering a new revision. That made AI assistance useful, but also made verification more important.
The Outdoor Box
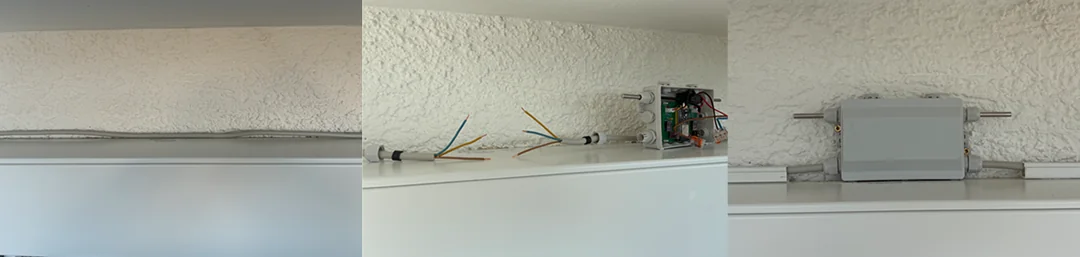
The enclosure is a small outdoor wall-mount box. The PCB sits inside it, while the two DS18B20 waterproof probes exit through cable glands to measure temperature outside the box body.
The tricky detail is that humidity and air pressure do not make sense if the enclosure is sealed like a container. The SHT31-D and BMP580 sensors need air exchange, but the electronics still need protection from dust, dirt, and direct weather exposure.
For that reason I added four small pressure equalization membrane vents to the box. They behave more like filtered breathing points than open holes: air can pass through, while dirt and splashing water are kept away from the inside. That gives the pressure and humidity sensors a better chance of measuring the outside environment instead of stale air trapped in the plastic case.
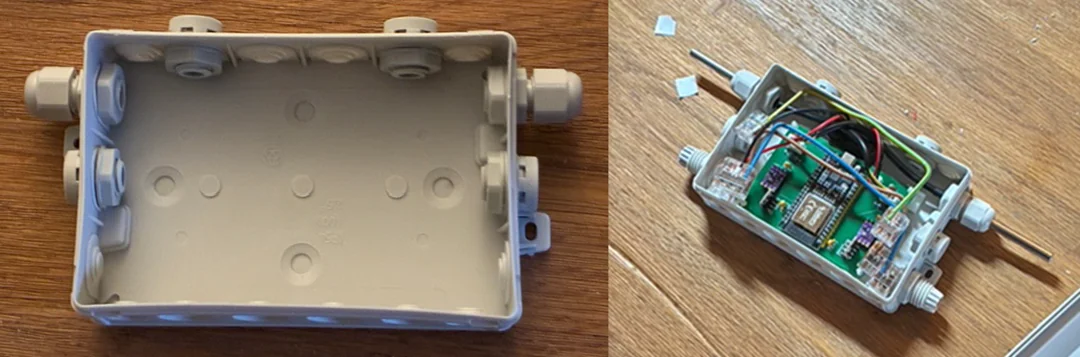
The box also has a practical emergency path: there is still direct USB-C access to the ESP32 inside. Normal updates happen over OTA, but if Wi-Fi configuration or firmware ever breaks badly, I can open the enclosure and flash it directly without dismantling the whole installation.
Mounting happened above the balcony door, where I already had a clean cable path available. The final result is not invisible, but it is tidy enough and much better than a temporary electronics experiment hanging from a window.
Firmware and Local Interface
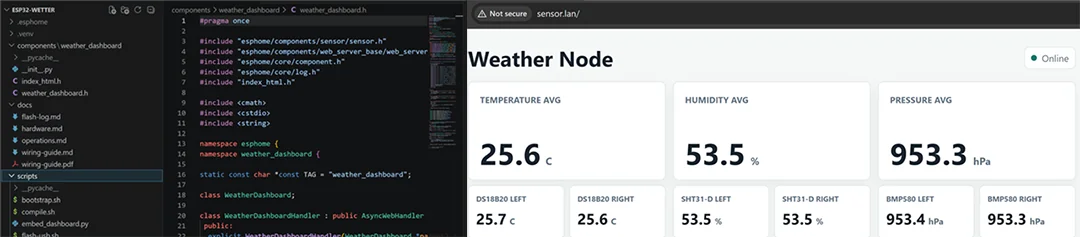
The firmware is built with ESPHome and i gave it its own private repository with the firmware config, local ESPHome component overrides, dashboard HTML, helper scripts, documentation, and contract tests.
The node uses a static LAN address and exposes several endpoints:
/readings.jsonfor current structured readings/history.jsonfor rolling on-device history/metricsfor Prometheus exposition
The firmware behavior is compact but useful:
- Sensor update interval:
10s - Published values: left, right, and averaged readings, plus Wi-Fi signal and uptime
- History window:
720one-minute samples in RAM, giving a 12-hour local window once SNTP time is valid - History format: scaled integer values, keeping the JSON compact enough for a small embedded device
There is also a fallback access point mode. On cold boot it starts after 10 seconds if the normal LAN is not reachable. After the node has successfully connected once, fallback AP startup waits much longer, so the device does not unnecessarily expose setup mode during normal transient Wi-Fi problems. While the fallback AP is active, the portal can save Wi-Fi settings, static IPv4 settings, and NTP servers. This is also intended for when i move out one day and someone new moves in - they’ll eventually discover the device and will be able to access and manage it by Wi-Fi.
Grafana Integration
I did not make Prometheus scrape the ESP32 directly in the final Grafana setup. Instead, the private Grafana monitoring repository has its own Docker Compose service named weather now.
That service is a small Python/Flask exporter polling the ESP32 node and importing the node’s rolling history from /history.json on boot while simultaneously exposing a cleaner monitoring surface on port 18015.
Prometheus then scrapes the weather container, giving me one stable data path.
It forwards the raw left/right/average readings, tracks source freshness, reports sensor failure flags, and calculates trend metrics over 1h, 3h, and 6h windows, deriving a simple weather state such as Stable, Clearing, Deteriorating, Front Approaching or Rapid Change.
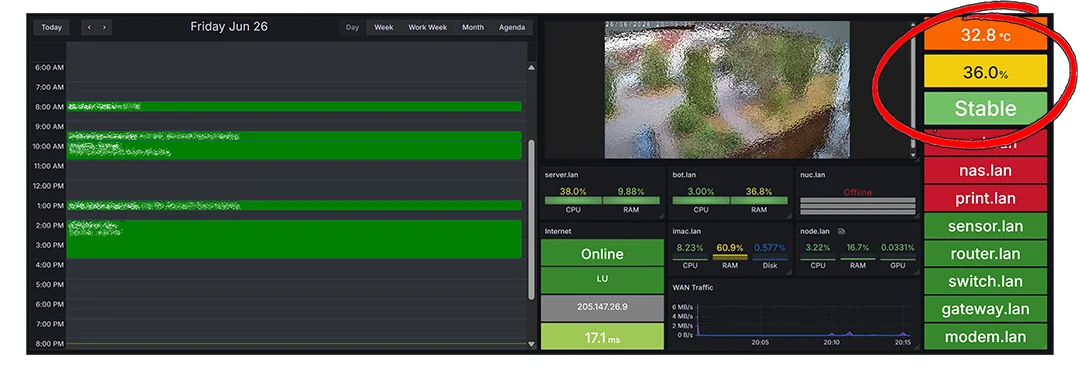
The main overview dashboard shows the compact state tile next to the other household monitoring panels, which is exactly what I wanted from the beginning.
What AI Actually Changed
The most valuable AI contribution was not that it wrote some code. That part is useful, but expected by now.
The more important change was that it made the hardware process feel closer to a software architecture loop. I could ask for a pin map, challenge it, compare it with the ESPHome config, turn it into a wiring guide, generate tests for the assumptions, and then come back later with the physical constraints of the box and the PCB.
That matters because hardware has a lot of quiet failure modes. A misplaced pull-up, duplicated I2C address, missing common ground, wrong capacitor placement, or sealed humidity sensor box might not look dramatic in a schematic, but each one can ruin the project. Having an assistant repeatedly inspect those details made the project less error-prone.
At the same time, this is exactly where I would not trust AI blindly. The final responsibility still sits with the person touching the board. I checked the wiring, inspected the solder joints, flashed the ESP32, watched the logs, ran the smoke tests, and verified the Grafana output. AI can accelerate the process, but it cannot smell a soldering mistake or notice that an outdoor box is physically mounted badly.
Result
This project ended up larger than the initial idea, but in a good way. I now have a small custom weather station outside the balcony door, built around:
- a two-layer ESP32 PCB
- six real sensor inputs
- pressure equalization vents
- OTA updates and local endpoints
- integration into the existing monitoring stack
For around 20 EUR in PCB cost, a week of manufacturing time, and some evenings of design, soldering, firmware work, and mounting, this turned into a surprisingly complete little system.
The best part is that it does not feel like a standalone toy. It is now part of the same local monitoring stack as the network, server, containers, calendar, and camera. That is the kind of integration I like most: a physical thing outside the door, designed with software-like iteration, then pulled back into the dashboard as a normal operational signal.