Grafana Camera Dashboard
After setting up my Grafana, Prometheus and Loki monitoring stack, the dashboard had already become a small operations center for my local network. It showed internet state, runner availability, container health, Pi-hole statistics, device load and a few public service checks.
What was still missing was the part that is useful before looking at any metric: what is actually happening outside?
So I decided to extend the setup with a Tapo C520WS outdoor camera, mounted to the ceiling of my balcony and angled downward onto my parking spot, and then integrate its live feed directly into the existing Grafana dashboard. In parallel, I also added a calendar view to the same stack, because the dashboard sits next to my workstation anyway and it made sense to turn it into a combined monitoring and day-planning display.
The camera itself is a consumer outdoor model, but I did not want the installation to look like a temporary USB-powered gadget. The goal was a clean fixed mount, proper cable routing, and a power setup that could live outside without exposing anything sensitive to rain, dust, or accidental contact.
Hardware Installation
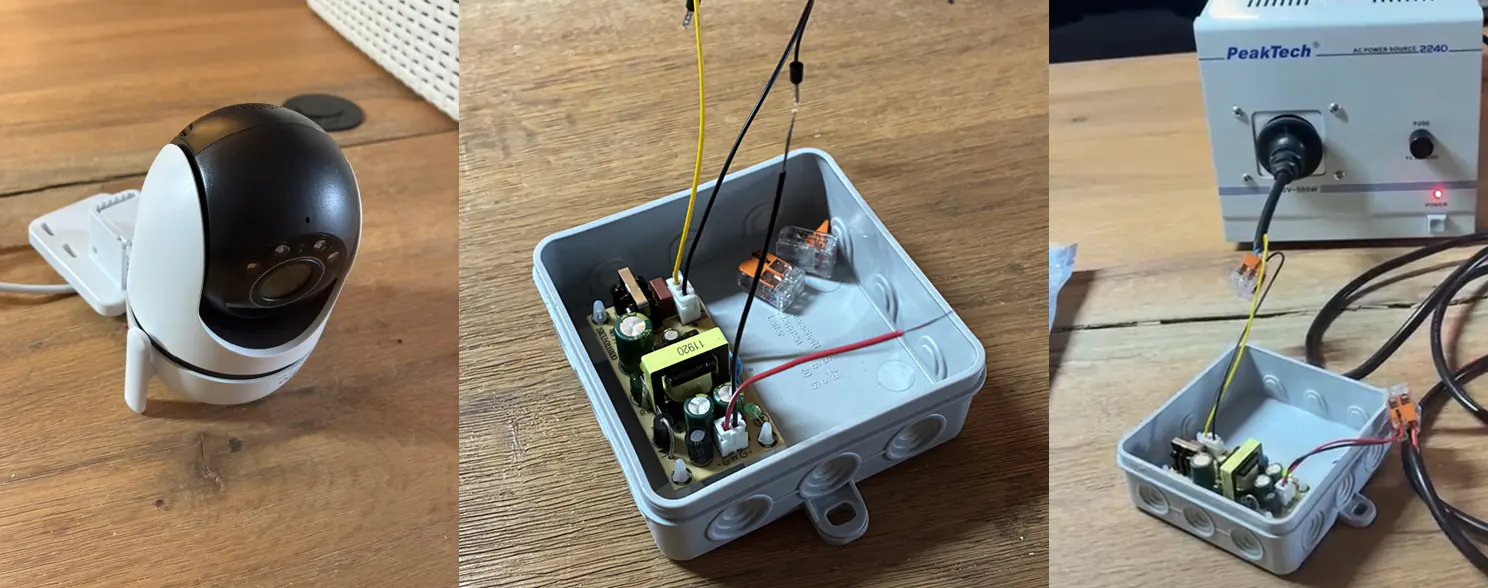
The interesting part was the power delivery. Before mounting anything outside, I first tested the converter board in a dry run on my desk with a recently acquired Trenntransformator. For this kind of 230 V bench work, that is a sensible extra safety layer: the test circuit is galvanically isolated from the mains side, and a fault is much easier to contain at the bench than when directly working against the apartment circuit. It is not magic protection against every possible mistake, but it is the right tool to have between the wall and an experimental mains-side setup.
After that dry run, I reused an existing power line near the intended camera location and placed that small 230 V to 9 V converter board into a surface-mounted junction box, or Aufputzbox. The box is IP54-rated, so it is protected against dust and splashing water. That is exactly the class of enclosure I wanted for this location.
Inside the box, I mounted the 9 V transformer board on glued-in plastic standoffs (Abstandshalter) instead of letting the PCB sit directly on the enclosure floor. That keeps the solder joints and component contacts lifted away from the plastic surface and reduces the chance of accidental shorts. For the actual wiring, I used WAGO lever connectors, which are standard spring-clamp terminals and make the line, neutral, protective earth, and low-voltage connections much cleaner than improvised screw or twist connections.
This is not meant as a wiring guide. Working with 230 V mains requires proper isolation, correct terminals, strain relief, protective routing and testing before anything is energized. In my case, the mains side stays enclosed in the junction box, while the low-voltage side powers the camera.
After the electrical side worked on the bench, I moved on to the physical installation: mounting the camera, installing the Kabelkanal, placing and wiring the Aufputzbox, cleaning up the cable path, and painting the exposed parts so the result blends into the existing wall and balcony area.
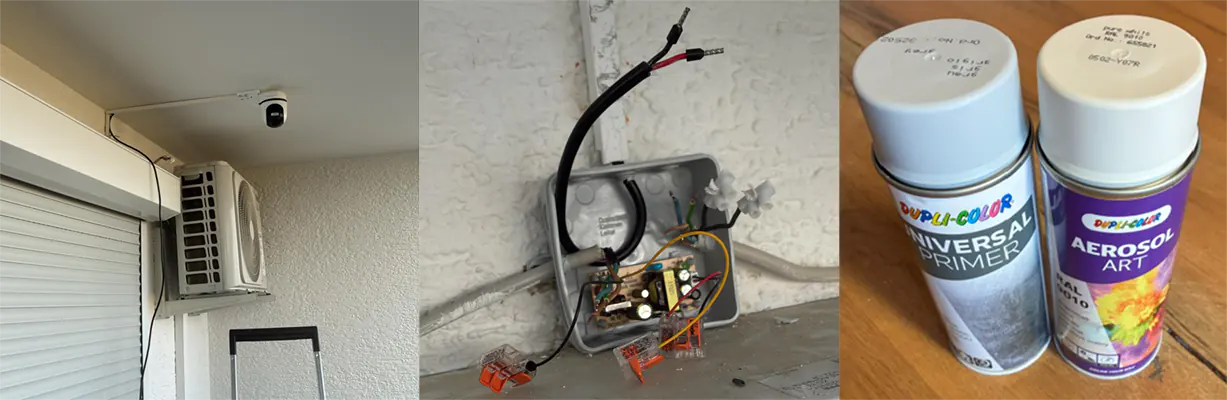
That part took longer than the software, but it matters. A monitoring setup is only as good as the weakest practical detail around it; if the cable routing is ugly, exposed, or unreliable, it eventually becomes the real problem.
The short recording above was mainly a sanity check: camera powered, image stable, balcony-ceiling mount usable, and the parking spot visible enough for the intended purpose.
Browser-Friendly Streaming
The Tapo camera exposes an RTSP stream, but Grafana cannot simply display raw RTSP in a browser panel. Browser support around live video is a different problem space: Safari, iOS, Chromium, autoplay behavior, codecs, transport protocols, and iframe constraints all matter.
So I added a dedicated camera container to the existing Docker Compose stack. The camera service is built around MediaMTX. The input is published internally as a raw RTSP path. From there, an on-demand FFmpeg process republishes a browser-friendly camera path:
- 720p output
- 24 FPS
- H.264 baseline video
- Opus audio
RTSPtransport internallyWebRTCandHLSexposed externally
The important point is that transcoding starts only when a reader connects. I did not want the camera container burning CPU all day just to produce a stream nobody was watching. The WebRTC listener and MediaMTX API stay bound to loopback inside the container. Port 18011 is served by a small Nginx wrapper, which keeps the public Grafana iframe URL stable while proxying the internal WebRTC player and API checks.
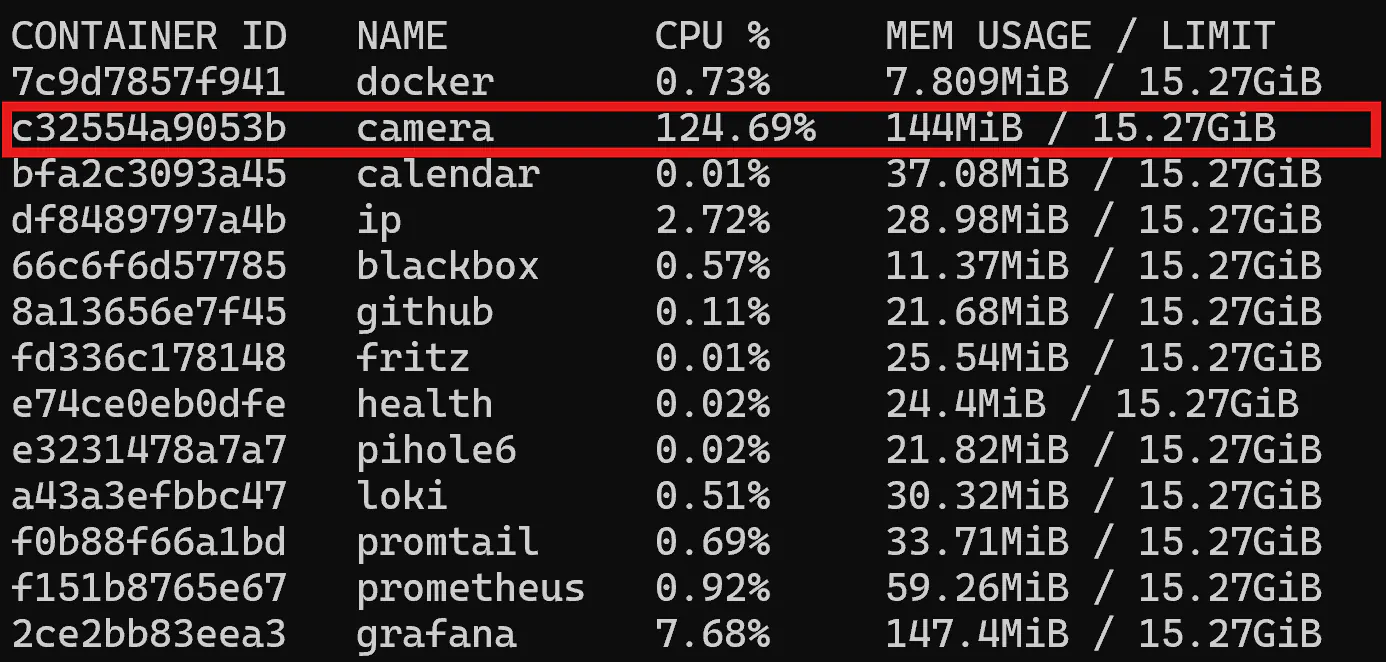
The docker stats check made it obvious that the expensive part is not the camera itself, but its necessary internal live transcoder. As seen in the usage image, the camera container takes roughly one full CPU core when operating. It was two cores at 2K, which is why I settled on the 720p / 24 FPS compromise: good enough for a dashboard tile, much cheaper than pushing the full source stream into a browser, and still responsive enough for quickly checking the parking spot.
Dashboard and Health Checks
The dashboard itself is still provisioned through the same repository flow as the rest of the stack.
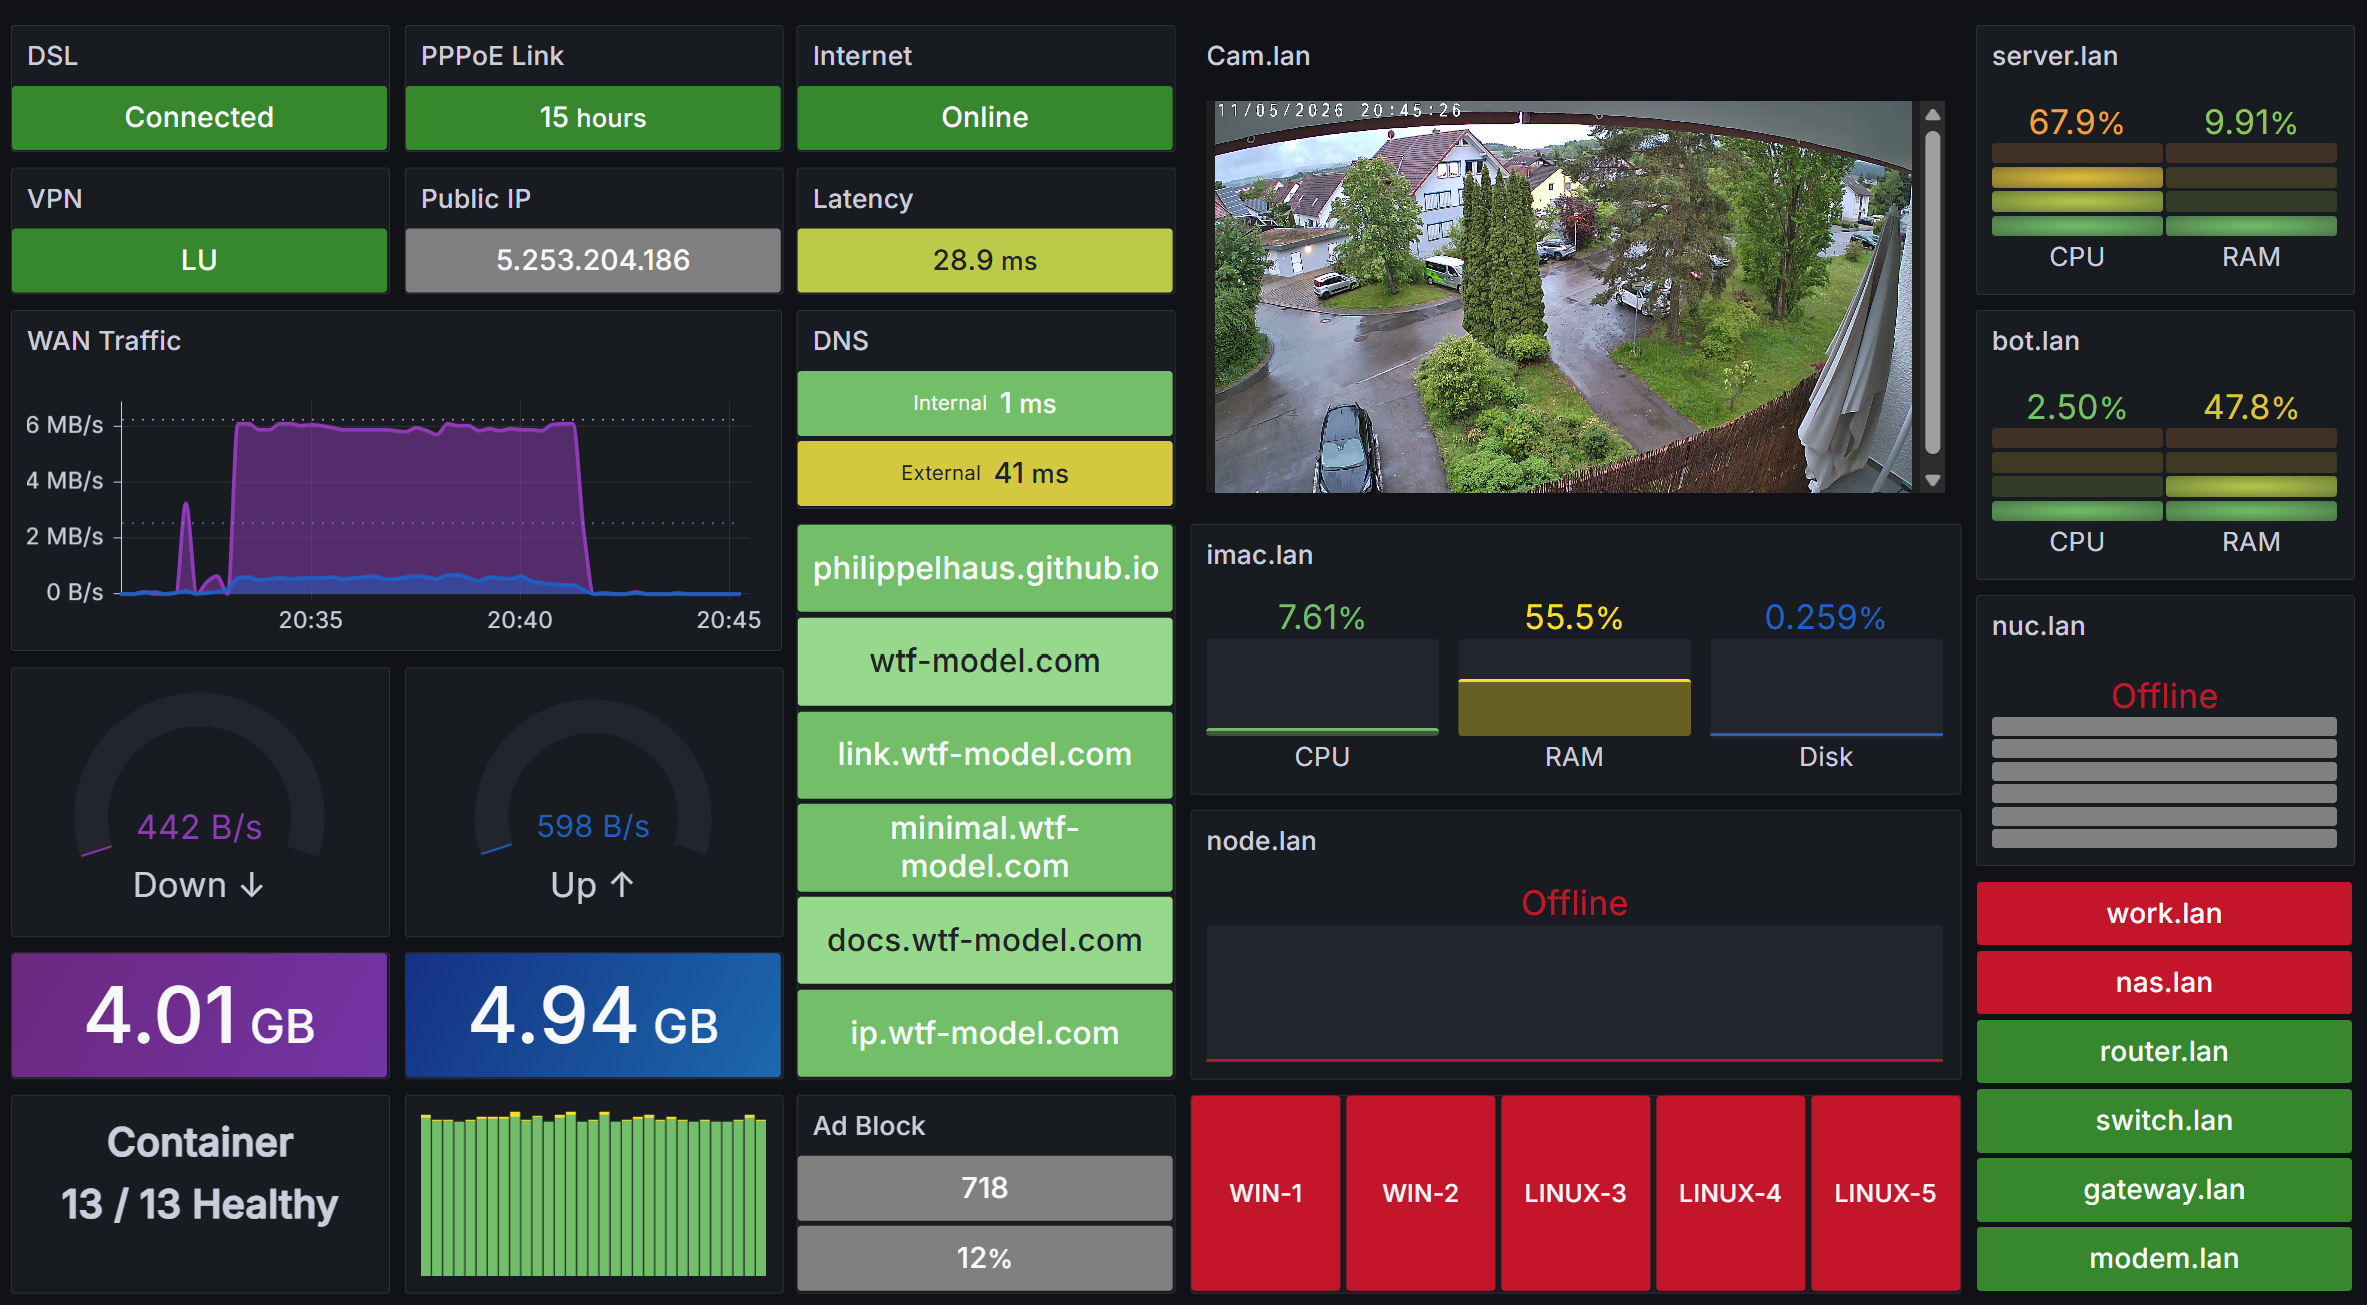
For health, I did not treat the stream itself as a Prometheus metric. Instead, the existing Blackbox exporter probes cam.lan via ICMP. That is enough for this dashboard. If the camera host responds and the container is running, the live tile is a direct visual confirmation. The stack already monitors container state as well, so the practical failure modes are covered without overbuilding a separate camera exporter.
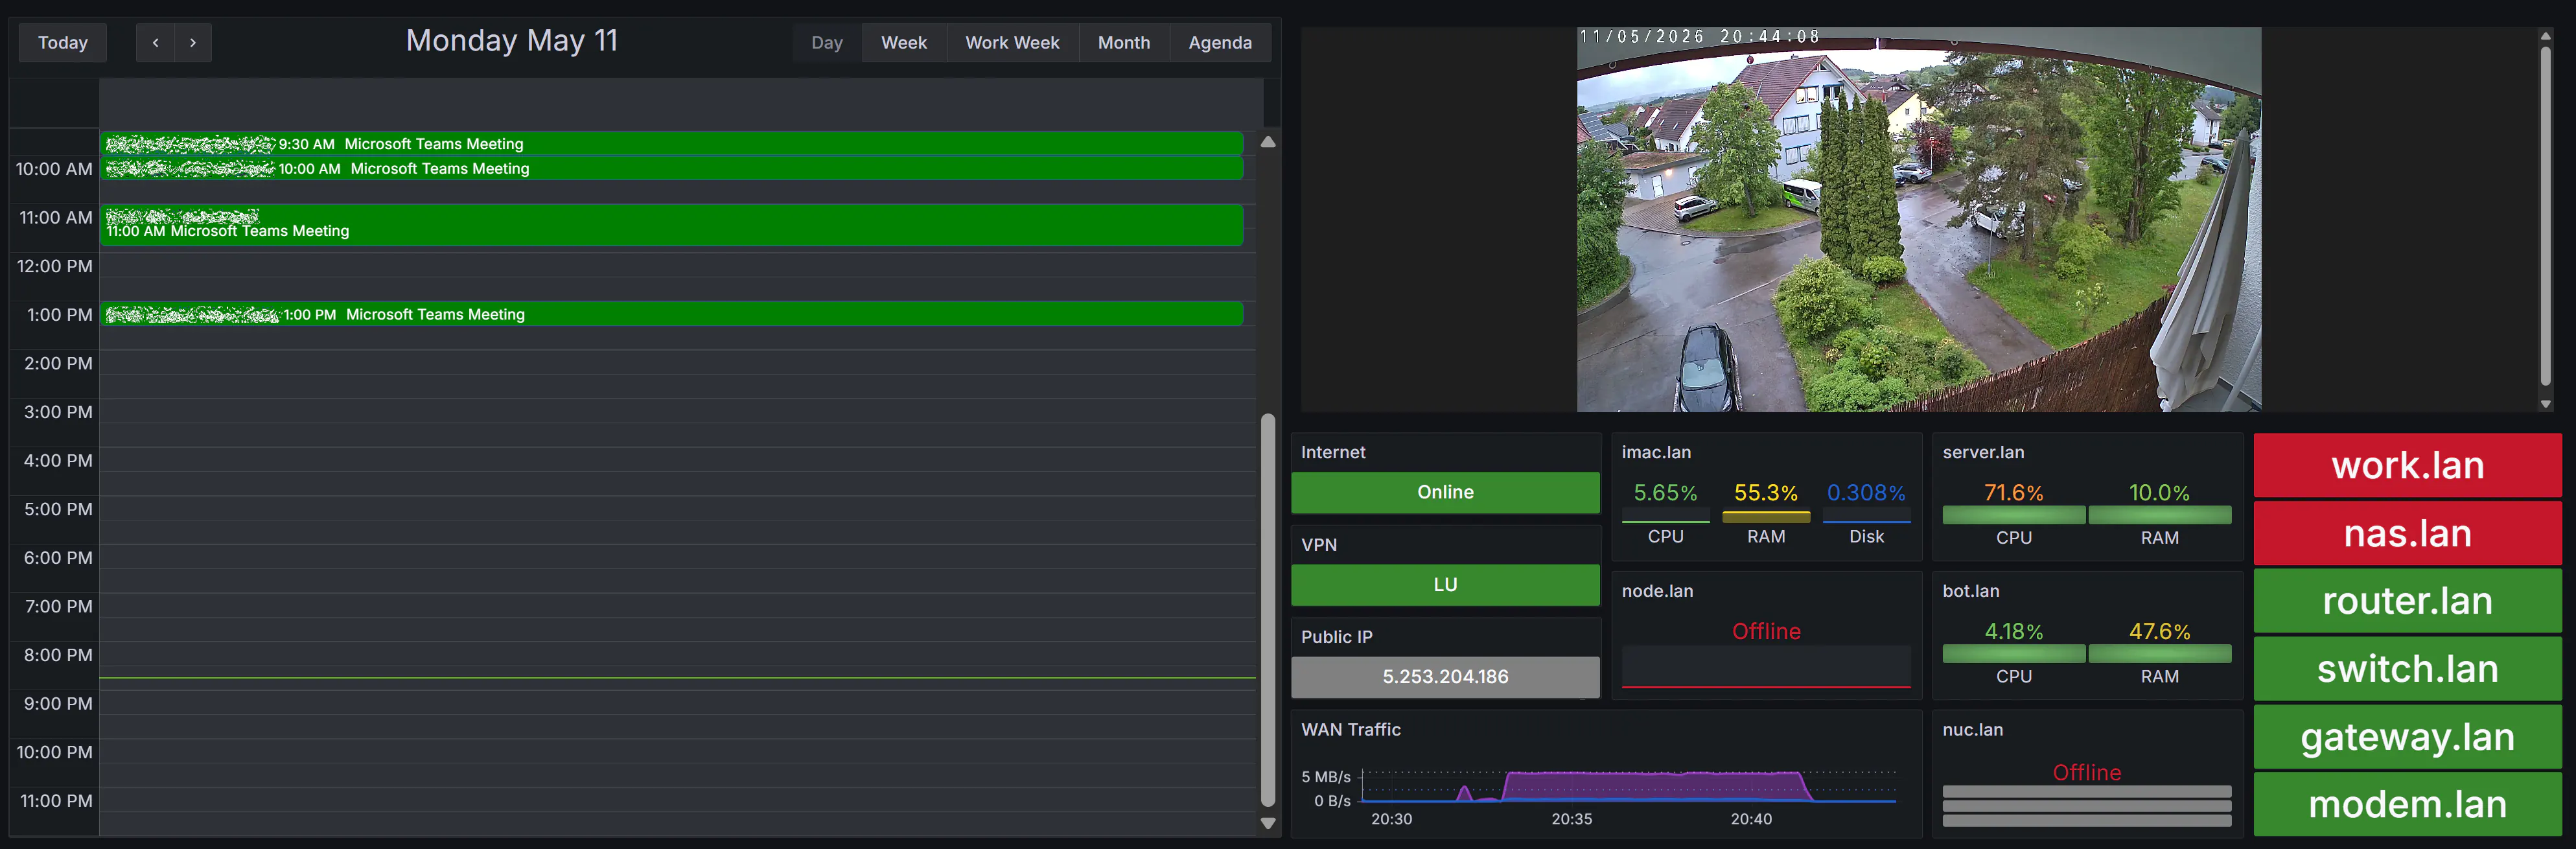
Calendar Integration
While updating the dashboard layout, I also added a standalone Calendar view. The actual source of the work calendar is my CalendarSync project: a small .NET background app that performs a one-way sync from local Outlook calendars to Apple iCloud Calendar through CalDAV. It is designed for restricted Windows environments where Microsoft Graph or a full Exchange integration would be overkill. I use the tool myself on client devices to keep all my different calendars centrally synchronized.
Inside the Grafana stack, the new calendar container reads the iCloud CalDAV credentials and calendar identifiers from .env, then exposes:
http://calendar:18012/eventsas Grafana-friendlyJSONhttp://calendar:18012/metricsas Prometheus health metrics
Grafana itself installs the marcusolsson-calendar-panel and yesoreyeram-infinity-datasource plugins on startup. The Calendar dashboard then queries the local container through the provisioned Calendar JSON datasource.
Result
The result is much more useful than a pure metrics board. On one display I can now see whether the network is healthy, which systems are online, what my day looks like, and what is happening around the car. The updated stack now has two new practical functions:
- A live outdoor camera feed embedded directly into Grafana
- A day-view calendar dashboard backed by iCloud CalDAV data
I tend to toggle between the two dashboards, depending on my current tasks for the day.
Technically, the camera part was the more interesting problem. It touched hardware installation, low-voltage power delivery, RTSP, WebRTC, HLS, Docker networking, browser iframe behavior, and Grafana provisioning. The calendar part was smaller, but it fits the same philosophy as the rest of the monitoring stack: keep the data local, expose a simple interface, and let Grafana render the final view.
This is exactly what I like about the current setup. It is not a productized monitoring distribution, and it does not need to be. It is a private, purpose-built operations dashboard for my own local environment, combining electrical work, networking, DevOps and day-to-day usability in one place.
Data Protection
The camera is configured for a private-property monitoring use case and is deliberately limited in scope. The relevant measures are:
- Live streaming only: no footage is recorded or stored.
- Visible notice: there is a warning sign near the monitored area.
- Restricted view: public areas are blacked out in production.
- Private focus: the camera is aimed at my own parking spot and car.
The screenshots in this post are only illustrative, but the operational setup follows the same principle: keep the camera useful for its intended purpose while staying aligned with German/EU data protection expectations.