







AI Gateway and LAN Operations
I added two focused entrypoints to my infrastructure: ai.gateway.lan for AI requests and ops.server.lan for operations. They build on my earlier work on infrastructure with AI agents, but solve two everyday problems: seeing where AI requests go, and knowing which hosts need attention.
1. AI Gateway: one LAN endpoint for cloud AI
I no longer want each client to manage its own provider configuration and credentials. AI Gateway accepts requests from my trusted LAN and routes them to configured external providers. The models still run in the cloud; this is not a local inference server.
The mediator is written in Rust, with a Rust/WebAssembly dashboard. My current routing uses Codex for subscription-first text and vision, the OpenAI API for eligible fallback and API-only capabilities, and fal for selected image and video jobs. The caller still executes tool calls. Gateway does not become another autonomous agent.
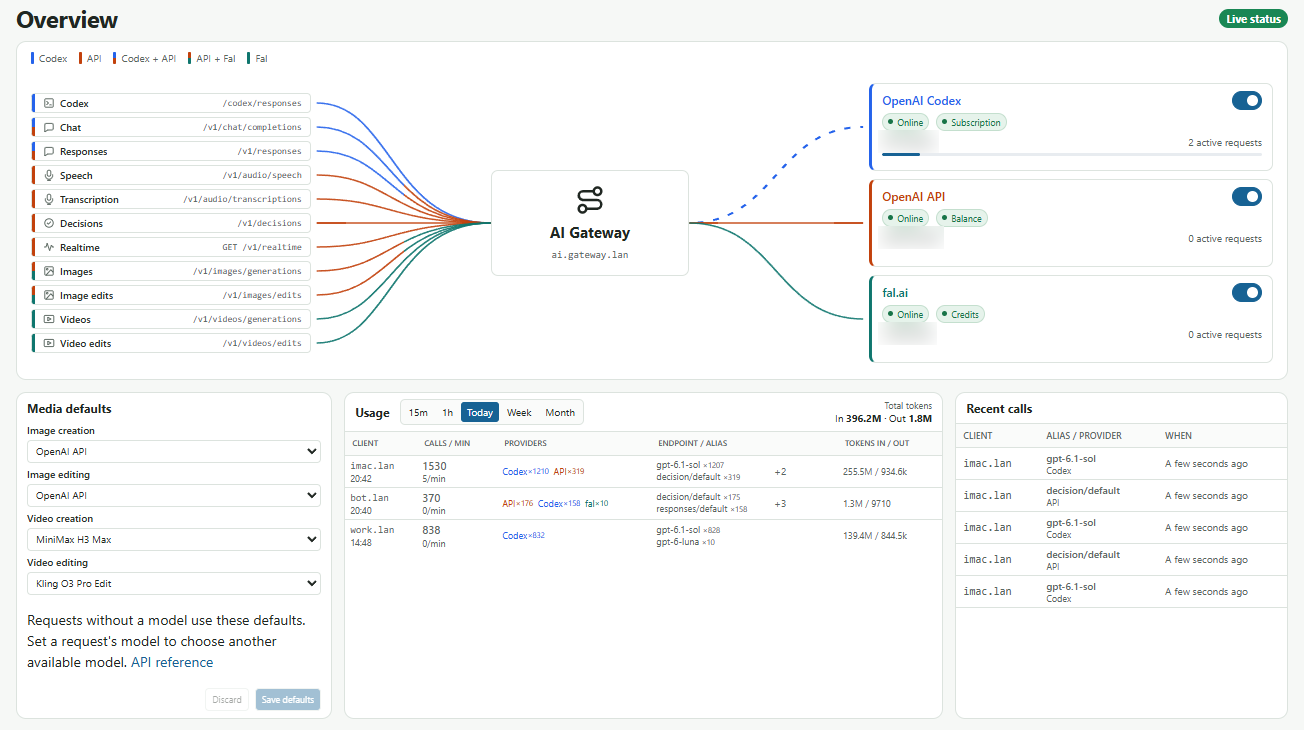
The dashboard separates provider connectivity from subscription or credit status. A reachable provider is not necessarily able to accept a particular request. Below that, I can see which machines are calling Gateway, their usage, and recent calls. Saved image and video defaults give clients a shared starting point without preventing an explicit per-request choice.
Provider credentials stay on Gateway. Accepted LAN clients do not need a separate Gateway key or browser login, so network admission is an important boundary, not a substitute for authentication on a public service. Usage records and request receipts also matter: accepted or uncertain work must not be blindly resubmitted after a connection failure.
2. LAN Operations: a quieter view of host health
LAN Operations grew out of my earlier inspection dashboard at inspection.server.lan. I merged that view into ops.server.lan, bringing inspection, unified backups, and automated updates together for Server, Gateway, and Bot. Updates have a deliberate holdback period before installation to reduce exposure to newly compromised releases. This adds a safety layer; it does not eliminate supply-chain risk.
The page also shows connectivity and AI operating cost. Grafana remains the place for deeper metrics; this page answers the shorter question: What needs my attention now?
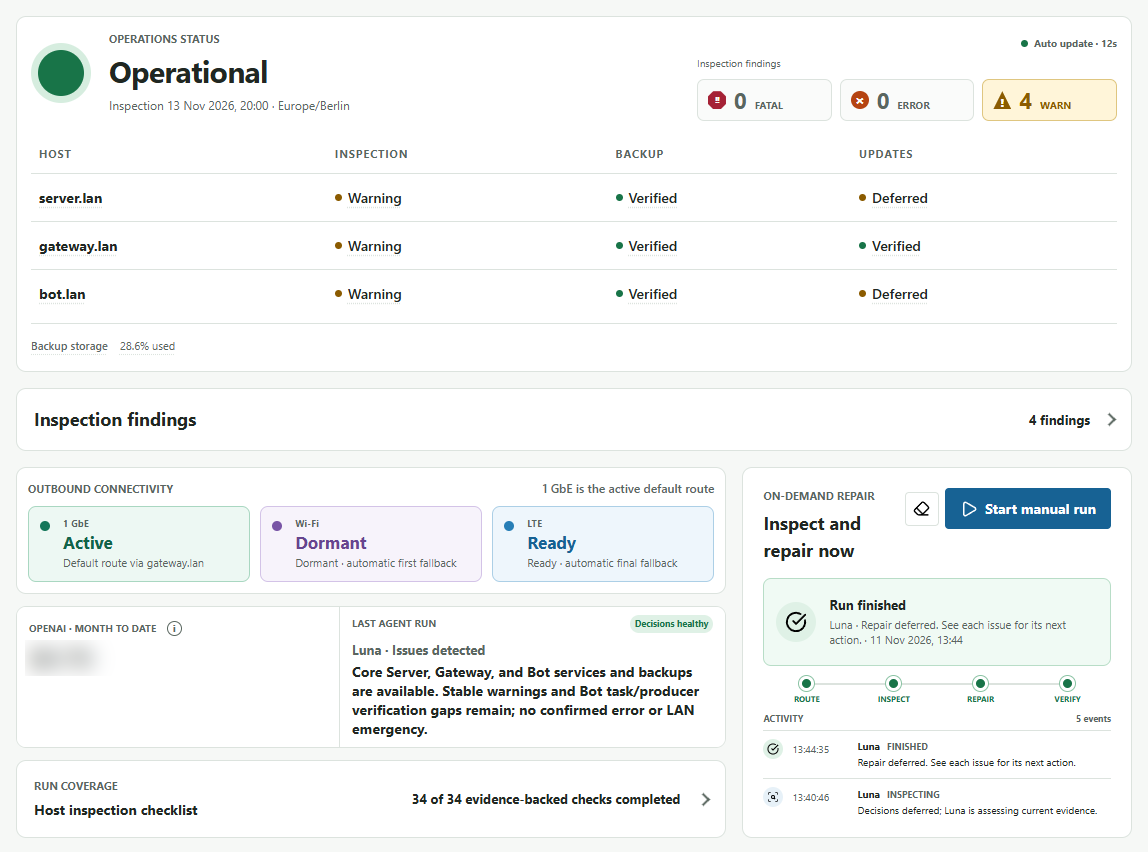
I reduced the interface noise by keeping the status table compact and moving supporting details into tooltips that also work with keyboard focus and touch. Inspection findings remain expandable, including warnings that do not make the whole environment unhealthy.
That distinction is deliberate. In this snapshot, the overall status is green while four warnings remain visible. Green does not mean there is nothing to investigate, and missing or stale evidence must not count as healthy.
Scheduled inspections are coordinated on Server and still use the separate OpenAI Agents API, as described in my earlier Agents API post. Evidence collection, assessment, and repair remain separate steps, with safety gates and durable receipts. The manual inspection entrypoint stays available, but the dashboard is not a general-purpose shell or a view into private prompts and credentials.
Two hosts, discoverable interfaces
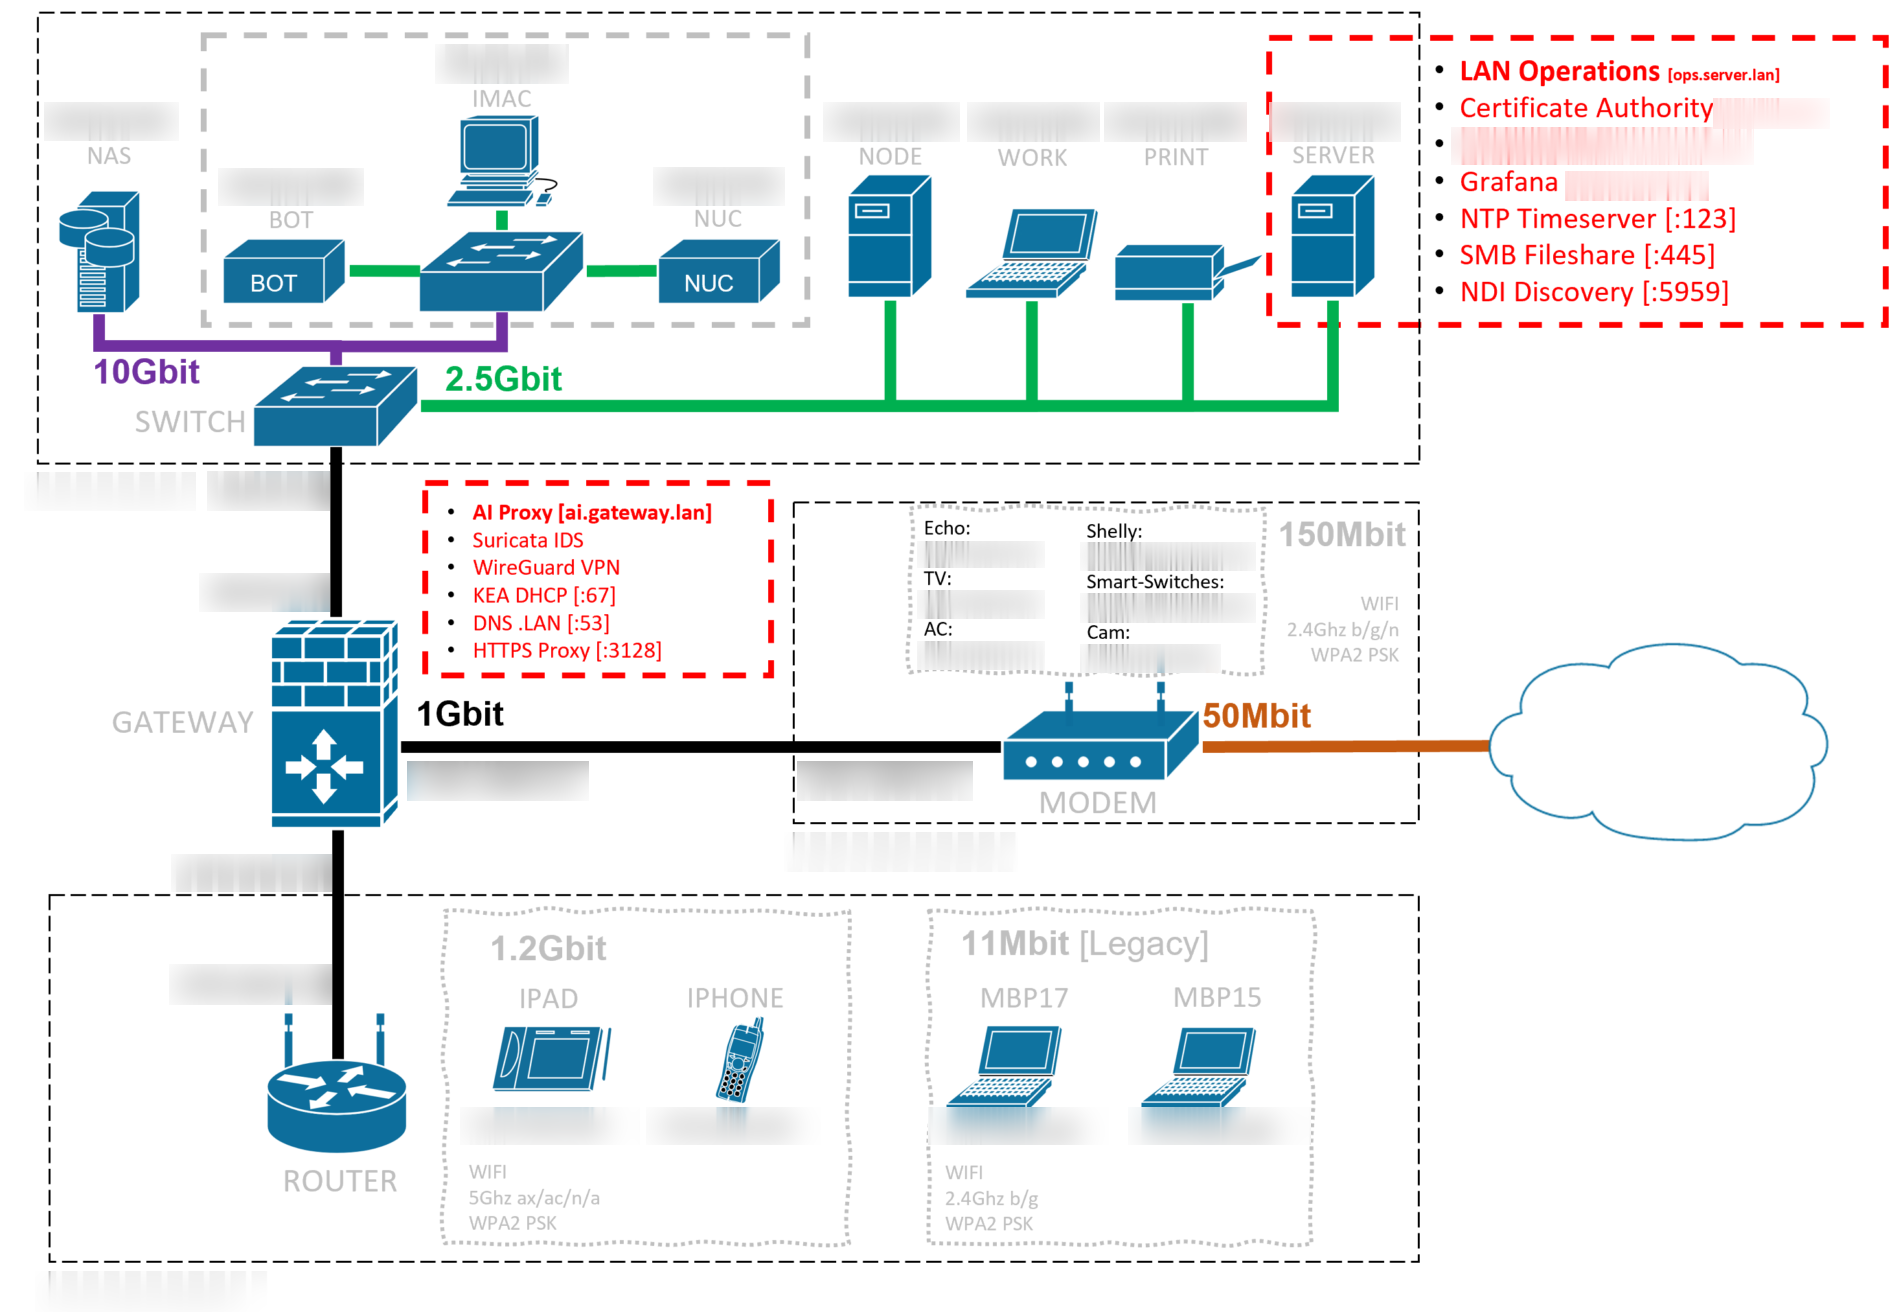
My network map puts the two services in context: AI Gateway belongs on Gateway, while LAN Operations belongs on Server alongside the shared infrastructure services.
Both entrypoints also work for agents without requiring them to interpret the dashboard. Their HTTP Link response headers point to an llms.txt guide and OpenAPI descriptions. An agent can discover what the service does, read its limits, and find the relevant API contract before making a request. The discovery information explains the interface; it does not grant permission to change the infrastructure.